
Real-Time Data Acquisition (DAQ) and Temperature Logging with LucidControl

- 16 analog and digital IO channels
- HTTPS, Modbus TCP/IP, MQTT, FTP
- SSL/TLS secured
- Data logging function
- Compatible with LucidControl software
- DIN-Rail enclosure
- Multi-Protocol

LucidControl USB IO Modules
- Data acquisition and control
- Cost effective and flexible
- Platform independent
- Windows® and Linux
- Compatible with Raspberry Pi
- Clippable on DIN-Rail
- Industrial & home automation
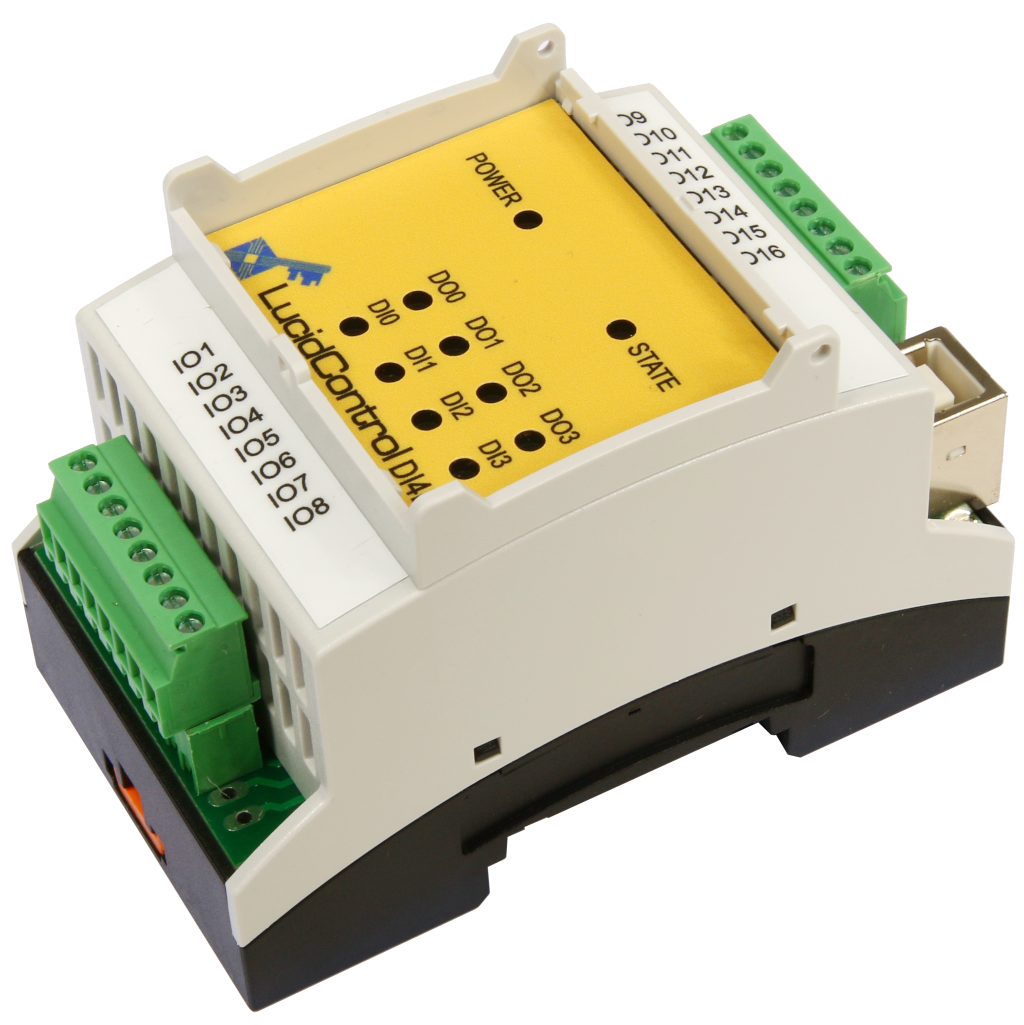
USB Digital Input Output Module
LucidControl Product Series
- 4 insulated digital input channels
- Counters, filters, edge detectors
- Pulse width modulation and timers
- 4 solid-state-relay output channels

USB Digital Input Module
LucidControl Product Series
- 4 / 8 digital input channels
- For 5V, 10V and 24V signals
- Opto insulated contacts
- Counters and edge detectors

USB Digital Output Module
LucidControl Product Series
- Opto insulated option
- 4 / 8 digital output channels
- Relay module option
- Pulse width modulation and timers
- Switching and power control

USB Analog Input Module
LucidControl Product Series
- Measurement range options
- 4 / 8 analog input channels
- e.g. 0-10 V or 0-20mA
- 14 bit resolution
- Acquisition of sensor signals

USB Analog Output Module
LucidControl Product Series
- 4 analog output channels
- Output range options
- e.g. 0 - 10 V or 4 - 20 mA
- 12 bit resolution
- 4 - 20 mA current interfaces
USB RTD Input Module
LucidControl Product Series
- 4 / 8 Pt1000 / Pt100 RTD channels
- Temperature range: +/- 180 °C, 360 °C
- 0.1 °C resolution
- Heat control applications
- Logging of temperatures

Data which are acquired by a system like LucidControl need often being monitored in real time. One method which is very efficient is a diagram recording values over time.
Especially for temperatures this is a very illustrative way which gives lots more information than pure numbers in a table.
In the animation you can see a recorded temperature logging diagram which was made by using our LucidControl RT-4 RTD input device. It shows the behavior of a Pt1000 temperature sensor (RTD) which was at first put into warm and afterwards moved to cold water.
It is obvious that the temperature follows an exponential function ex which is the case for many physical quantities. One additional example for exponential behaviour is the charging and discharging of a capacitor.
The question is how can such a diagram be created in your application and how does it run on the Raspberry Pi. In the following article shows how an application which records a diagram can be created and which tools are necessary.
[hr]
Prerequisites for USB Data Acquisition
- At first, please read the post How to create GUI applications with Java and Eclipse
- As development environment Eclipse IDE is needed. The final project can be downloaded and it can be imported including the sources to Eclipse directly.
- Of course the Java Development Kit is needed in order to create the application. This application should work with most JDKs, but I’m using Java 7.
- Download and install the Standard Widgets Toolkit.
- Setup the LucidControl Java API in order to access the LucidControl RT-4 USB IO device.
Which Charting Tool fits best for Data Monitoring?
There are four major free chart engines available:
- JFreeChart is probably the most comprehensive free tool having lots of different chart options.
- swt-xy-graph is a very good application for line charts and has a great implementation of real-time charts.
- SWTChart is a fundamental chart tool and supports different styles.
- BIRT is the Business Reporting Tool for Eclipse and has a chart library but is not useful for this case
The charting tools are made for different use cases and not all are suitable for real-time monitoring. BIRT for example was made for business reporting. For this application JFreeChart and swt-xy-graph seem best suited and we went for swt-xy-graph because it was especially designed for dynamic charts and it can be used for RAP (Remote Application Platform) applications.
Download swt-xy-graph and read the documentation.
[hr]
Setup of the Data Acquisition Project in Eclipse

Diagram Logging Hot Water
Download the lucidio.example.tempLogSwtXy project sources or check the download section for more information.
The project archive should be unzipped to some directory on your computer and it can be imported to your Eclipse workspace afterwards. Please check if all the necessary libraries are in the build path and download missing libraries if necessary.
Learn from the examples source code. It is quite simple and together with the swt-xy-graph documentation it should be possible to understand what is ongoing.
[hr]
Deployment on the Raspberry Pi
When the compiled project should be deployed on the Raspberry Pi Cairo library is missed. It can be installed by:
sudo apt-get install libswt-cairo-gtk-3-jni
Leave a Reply
Want to join the discussion?Feel free to contribute!